Statistics
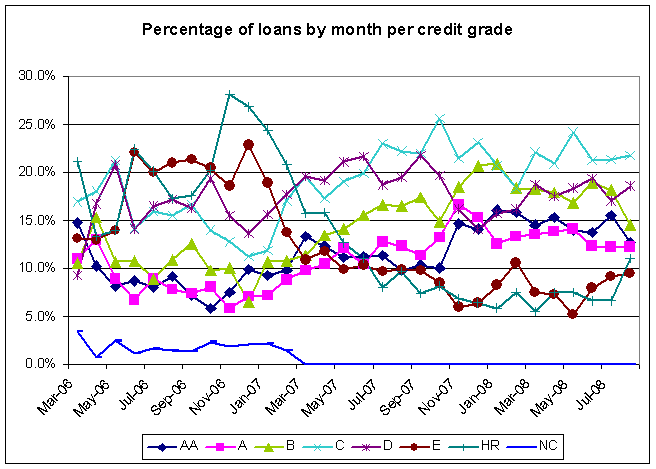
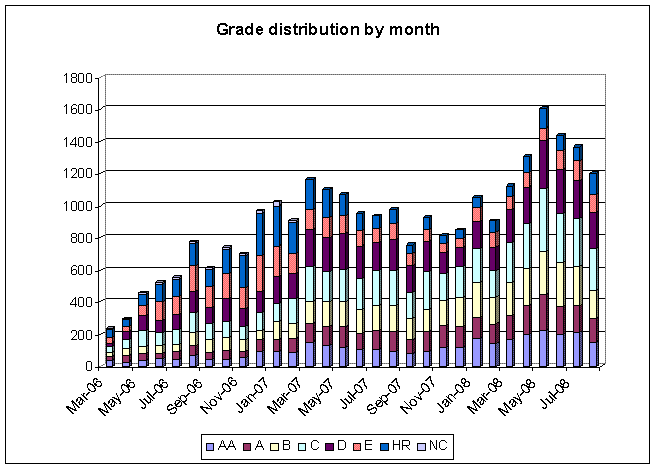
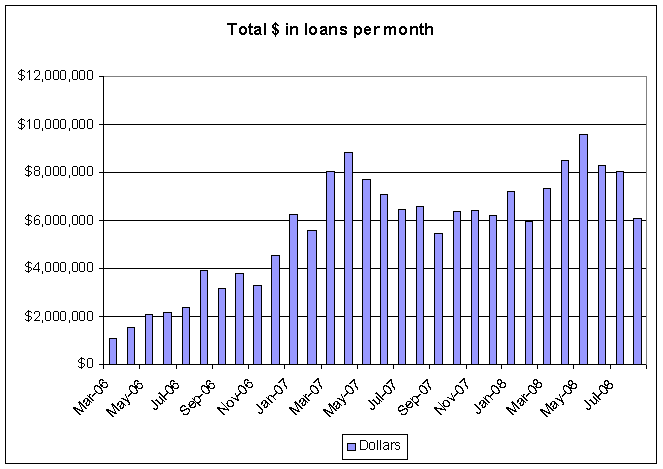
These are a few graphs illustrating lending activity on Prosper. Note that all graphs are based on the number of loans in a given month without regard to the size of the loans or total amount loaned.
The following graph is based on the same data as the one above, it just groups the number of loans into groups of grades to give a "cleaner look" to it. 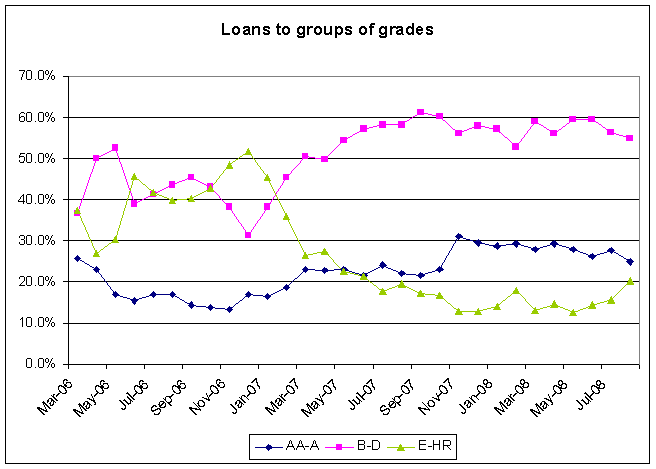
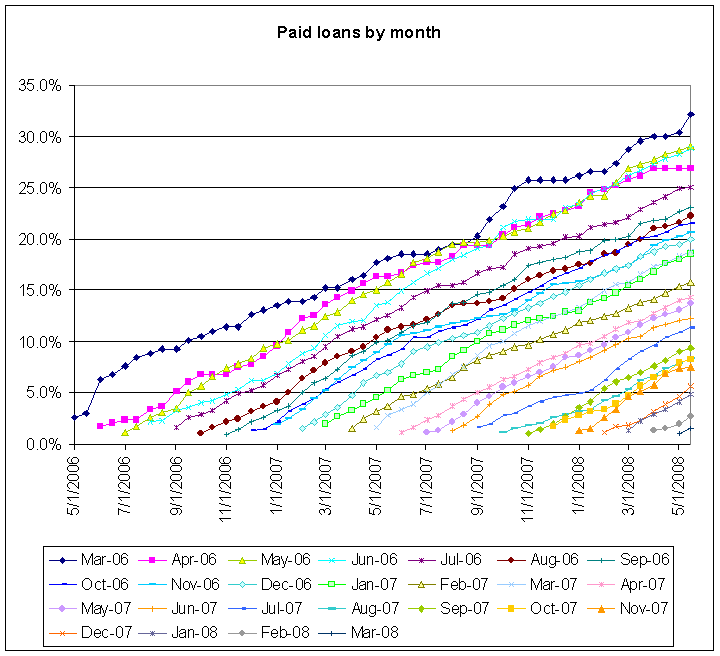
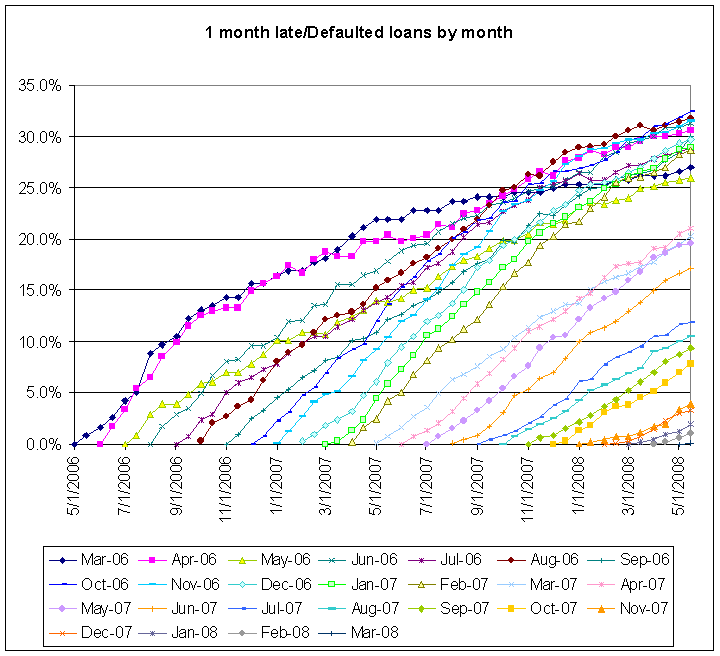
Here are a couple of graphs indicating payoff and late/default activity as well. Keep in mind that the late/default graph is slightly different from pninen's graph since it doesn't include any "repurchased" loans that I'm aware of like his does.
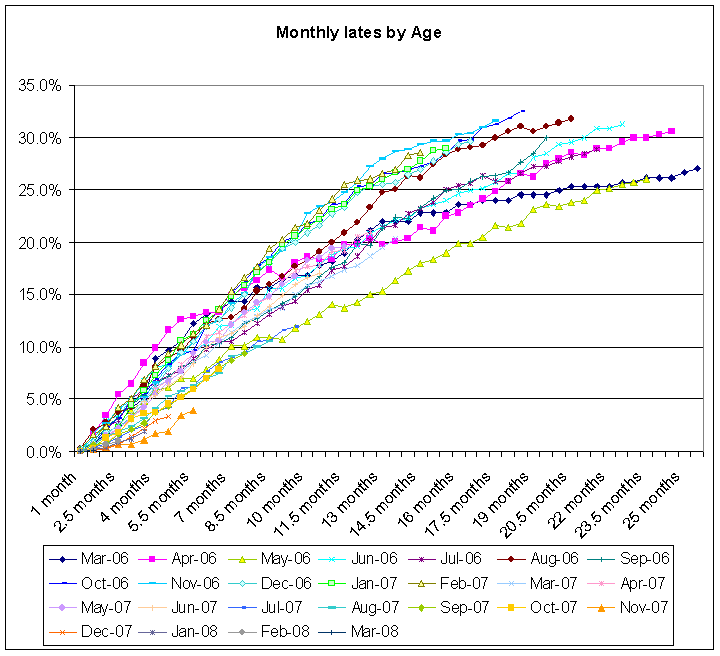
The following graph is the same as the one above except it shows all the graphs superimposed on top of one another as if they all started at the same time.
- Lates By Month
- Monthly Statistics
